Vertex Form
The equation for vertex form is written as y=a(x-p)2+q
An equation written in vertex form creates a parabola when graphed. This form is extremely useful when solving mathematical problems, because when a quadratic function is in vertex form, it can provide us with a significant amount of important information with a single glance. Each letter tells us a different piece of information about the parabola:
An equation written in vertex form creates a parabola when graphed. This form is extremely useful when solving mathematical problems, because when a quadratic function is in vertex form, it can provide us with a significant amount of important information with a single glance. Each letter tells us a different piece of information about the parabola:
- The
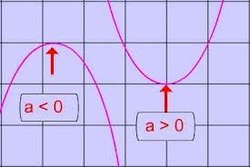
“a” value tells us the direction of the parabola’s opening. If a > 0 the
parabola opens upwards, resulting in a minimum value. If a < 0 on the other
hand, the parabola opens downwards, resulting in a maximum value. The “a” value
can never equal 0, because that would result in the formation of a straight
line, not a parabola. “a”, can also tell us the width of a
parabola. The smaller the value of “a”, the wider the parabola becomes
(fractions would result in a wider parabola due to this), but as the value of
“a” increases, the parabola becomes narrower.
- The
“x” and “y” values simply represent different points that lie on the parabola.
- The
vertex point of a parabola is the lowest point of the graph (if the graph opens
upward) or the highest point of the graph (if the graph opens downward). The
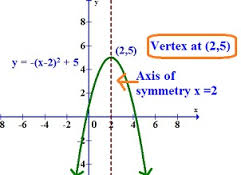
“p” and “q” values represent this vertex point. The “p” represents the x value
and “q” represents the y value. Therefore the “p” translates the parabola
horizontally across the x-axis, and the “q” translates the parabola vertically
across the y-axis. The “p” value also represents our axis of symmetry, the line
that divides the graph into two congruent parts, so that the graph on one side
is the mirror image of the graph on the other side. Another difference between
the “p” and the “q”, is that the “q” maintains the same value in the equation
and when plotted on the graph, while the “p” does not. If the p is negative
within the equation (x-p), it will be positive when plotted on to a graph, and if
the p is positive within the equation (x+p), it will be negative when plotted on to a
graph. In the picture an example of an equation with (x-p) is shown, and in that case "p" would be 2, and our "q" would be 5.
When a quadratic
function in vertex form is graphed it must fit each of these criteria:
- has
the shape of parabola
- has
an axis of symmetry with the equation x = p
- has
it’s vertex at “p” and “q”
- is
congruent to f(x)=ax2 translated horizontally by p units and
vertically by q units
